Step-by-Step Guides
Build and export reports
Run a ready-made report, build your own across several shows, save it, and export it as a spreadsheet or PDF.
Last updated 2026-10-08 · Applies to NotBot 1.4.4+ · Identical to the stable docs
The Reports page turns your shows into lists and totals you can print or open in a spreadsheet: one show or many, a date range, only certain kinds of sales, grouped by item or by buyer. Reports use the shows saved on this computer, so they work without an internet connection.
Before you start
- NotBot is open and signed in. See Sign in to NotBot.
- At least one show has finished with NotBot open. Reports fill in after your first show.
- For spreadsheets: a program that opens CSV files, such as Excel, Numbers or Google Sheets.
Open Reports
Step 1: Click Reports
In the purple bar across the top of NotBot, click Reports. It may say Loading show data… for a moment while NotBot gathers your shows.

Step 2: Get to know the Reports page
Three parts of the page matter:
- Reports: three ready-made reports. Show Summary is a PDF of everything that sold in one show. Buyer List is every buyer and their number (see Print a buyer number report). Cut Sheet adds up cuts of the same item, like 1 yard, 1/2 yard and 1/4 yard of one fabric, so you know how much to cut and for whom.
- My reports: reports you build and save yourself. Create custom report starts a new one.
- Import report… adds a report someone saved to a file, for example from your other computer.

Run a ready-made report
This example makes a Show Summary, a printable list of everything sold in one show.
Step 3: Click Show Summary
Under Reports, click the Show Summary box.

Step 4: Check the show and click Generate PDF
The long box under Show (1) already has your newest show in it. To pick a different show, click the box and choose one from the list; each show is listed with its date and start time.
Then click the orange Generate PDF button (2).

Step 5: Read or print the Show Summary
The report opens in your computer's PDF program. It may open behind NotBot; look for it in the Dock (Mac) or the taskbar (Windows).
At the top it says Stream Report, with the show's name and your shop name. Then come the show's totals (revenue, average sale, and how many auctions, purchases and buyers), and a list of every auction with the item, the buyer's number and username, the price and the time. Purchases, giveaways and payments that are still pending follow in their own sections.
To print it, press Command+P on a Mac or Ctrl+P on Windows and pick your regular paper printer. To keep a copy, choose File, then Save in the PDF program.

Step 6: Click All reports
Back in NotBot, click All reports at the top left to go back to the Reports page.

Build your own report
This example builds a report of last week's sales of $20 or more, without giveaways, added up per buyer. Change any choice to fit what you need; the results update as you go.
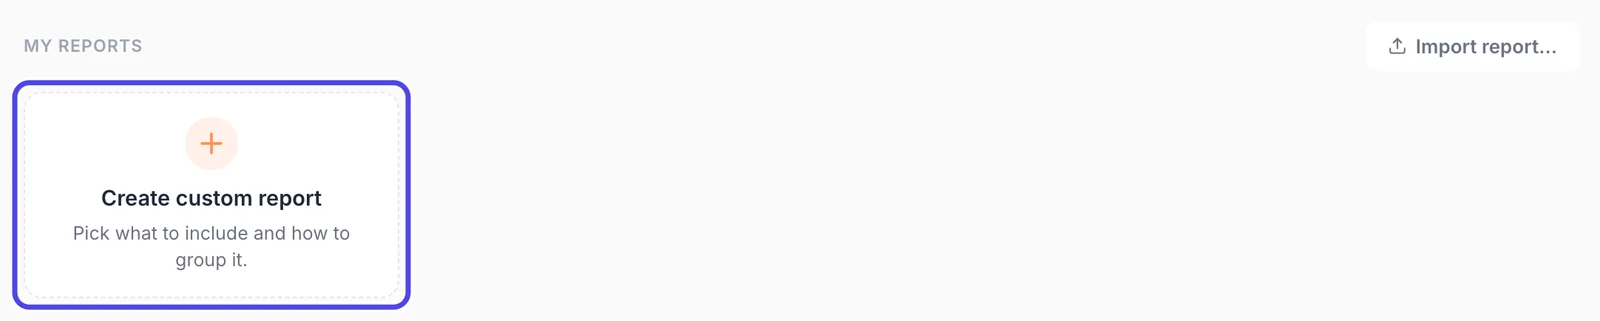
Step 7: Click Create custom report
Under My reports, click the Create custom report box.
Step 8: Name the report
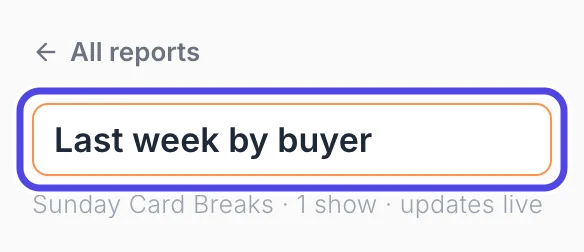
At the top left, the name box says My report. Click it, delete that and type a name you will recognize later, like Last week by buyer.
Step 9: Choose All shows
Click the long box under Show. The list has each of your shows, and All shows at the bottom. Click All shows to use more than one show.
To report on one show only, click that show instead and skip the next step.

Step 10: Pick the dates
A When row appears. Click Last 7 days.
The other choices are All time, Last 30 days and This month. Custom… shows two date boxes, so you can pick the first and last day yourself.

Step 11: Choose which sales to include
Next to Include, a tick means that kind of sale is counted: Auctions, Buy It Nows, Accepted Offers and Giveaways.
Giveaways are free, so for a sales report click Giveaways to take its tick away.

Step 12: Click Add a filter
A filter keeps only the sales that match it. Next to Filters, click + Add a filter. You can skip filters if you want every sale.

Step 13: Choose what to filter on
A filter row appears. Its first box says Item name. Click it and choose Price.
You can also filter on Buyer, Platform, Quantity, Buyer number, whether the label printed (Label printed) and whether it was a card break spot (Break spot).

Step 14: Type the lowest price
The row now reads Price ≥ $ with an amount box. ≥ means "at least". Click the amount box, delete the 0 and type 20.
The report now only counts sales of $20 or more. To turn a filter off without deleting it, click the tick box at the start of its row. The bin button at the end deletes it.

Step 15: Choose how to group the sales
Under Group by, click the long box that says Same item name and choose Buyer. Each buyer now gets one line with their total.
The other choices: Same item name puts identical items together, Box number groups by buyer number, Sale type separates auctions from Buy It Nows, My own groups lets you make groups by words in the item name, and Everything together gives one grand total.

Step 16: Read the results
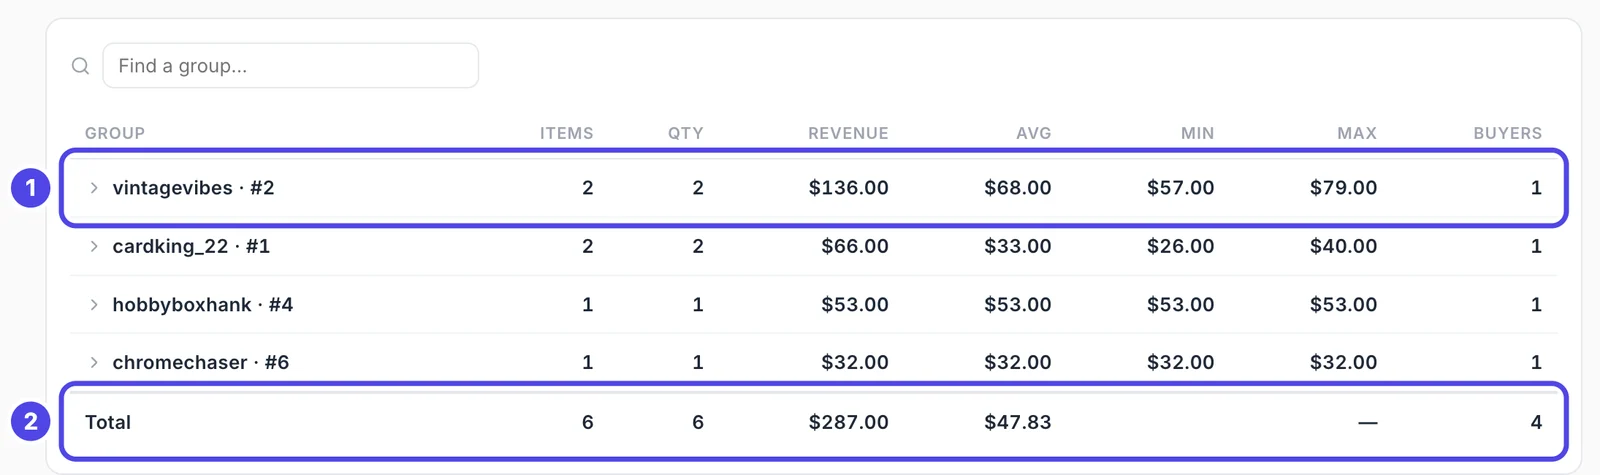
The table under your choices is the report. Each line is one group, here one buyer (1), with how many items they bought, the total (Revenue), and the average, lowest and highest price.
The Total line at the bottom (2) adds up everything in the report. Under the report's name at the top, NotBot shows the dates and how many shows are included.
Click a column name, like Revenue, to sort by it. Click it again to flip the order. To find one buyer in a long report, type their name in the Find a group… box above the table.
Step 17: Click a line to see its sales
Click a buyer's line. It opens to show each sale in the group: the item, whether it was an auction or a Buy It Now, the buyer and their number, the price, and the date and show it sold in. Click the line again to close it.

Save the report
Saving keeps your choices (what to include, filters and grouping) under My reports, so next time it is one click. It does not save which shows or dates you picked: choose those each time you run it.
Step 18: Click Save report
At the top right, click Save report.

Step 19: Click Save
A name box appears with your report's name already in it. Change it if you like, then click Save.
NotBot shows Saved "Last week by buyer" to My reports in the top right corner of the window. The Save report button now says Save as new…: use it later to keep a copy of the report under another name.

Export the report
Step 20: Save it as a spreadsheet
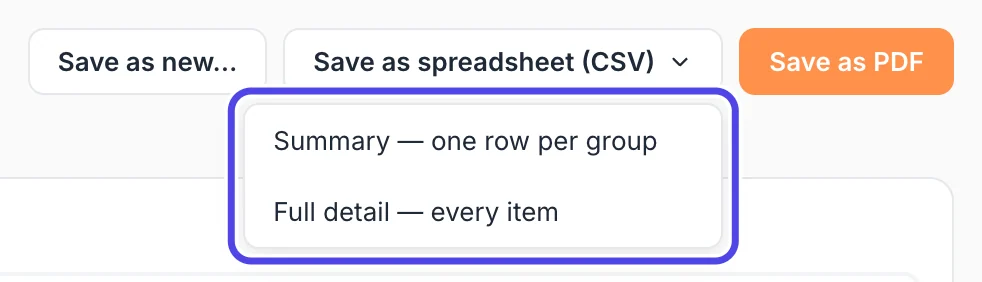
Click Save as spreadsheet (CSV). A small menu opens with two choices:
- Summary — one row per group: one row per buyer with their totals, like the table on screen.
- Full detail — every item: one row per sale, with every column.
Click the one you want. A save window opens: pick a folder you can find again, like Desktop or Documents, and click Save. Open the file with Excel, Numbers or Google Sheets.
Step 21: Check that the file saved
When the file is saved, NotBot shows Saved and the file's name in the top right corner of the window. The name starts with the report's name, then the dates and the day you saved it, so you can tell your exports apart.

Step 22: Save it as a PDF
To get a printable copy instead, click the orange Save as PDF. Pick a folder in the save window and click Save. The PDF then opens in your PDF program.

Step 23: Read the PDF
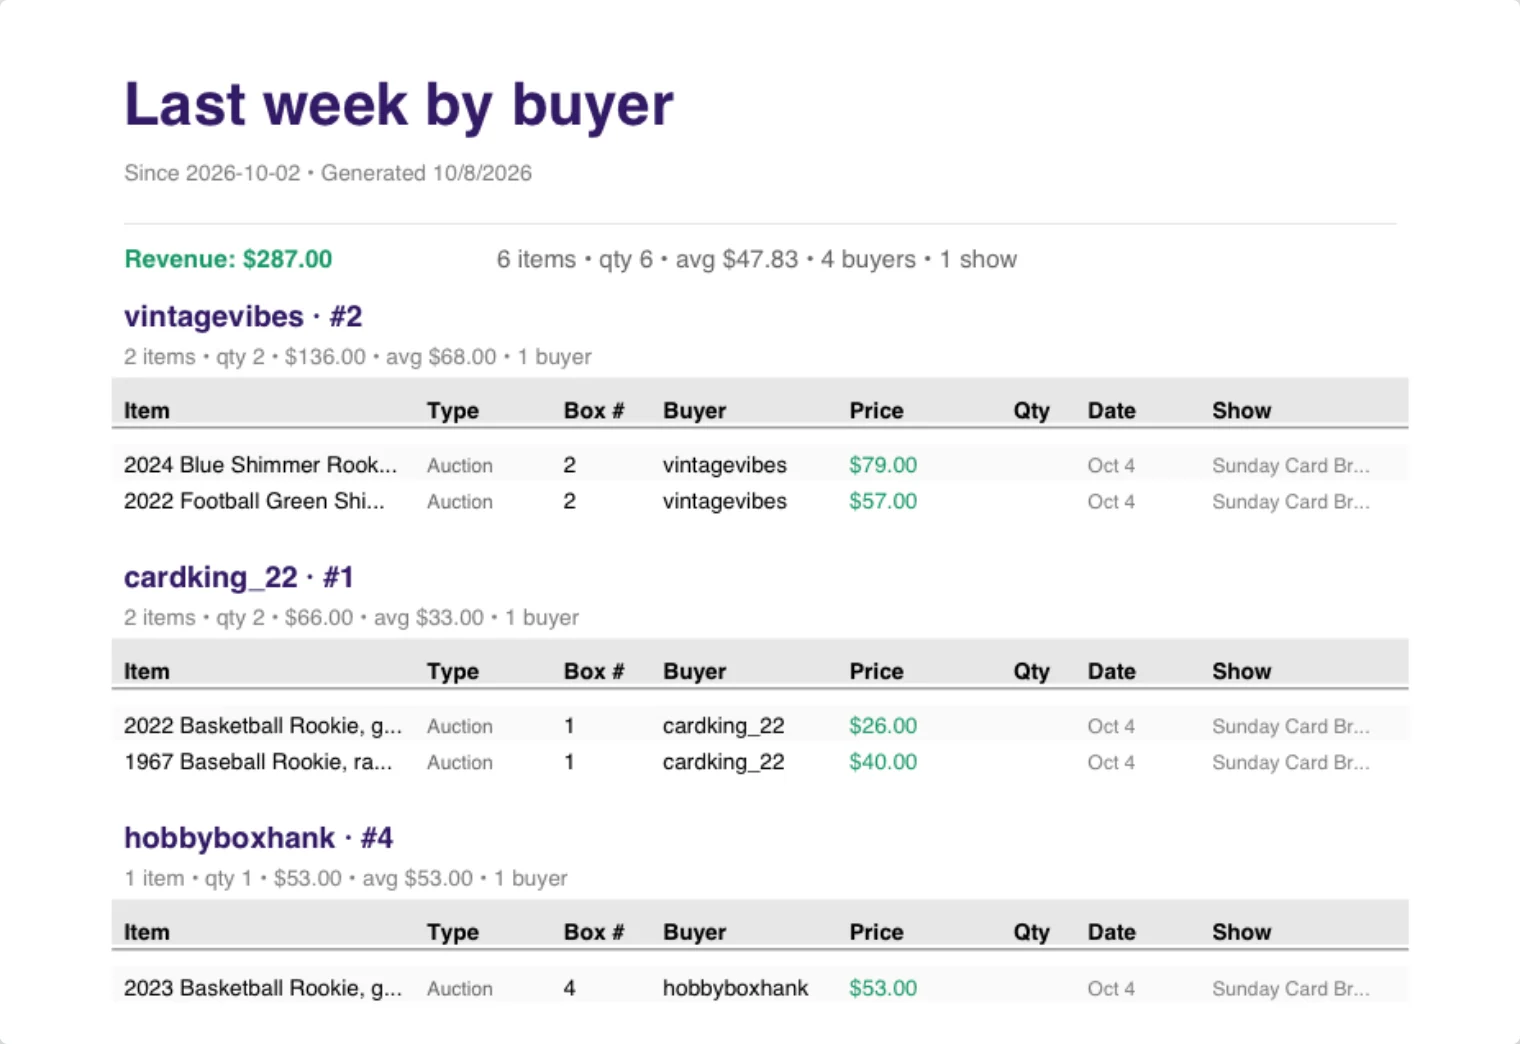
The PDF starts with the report's name, the dates it covers and the totals for the whole report. Then each group (here, each buyer) has its own section with its totals and every sale in it: the item, the kind of sale, the box number, the buyer, the price, the date and the show.
Use a saved report again, or move it to another computer
Step 24: Find your report under My reports
Click All reports at the top left. Your report is now under My reports. Click its name to run it again.
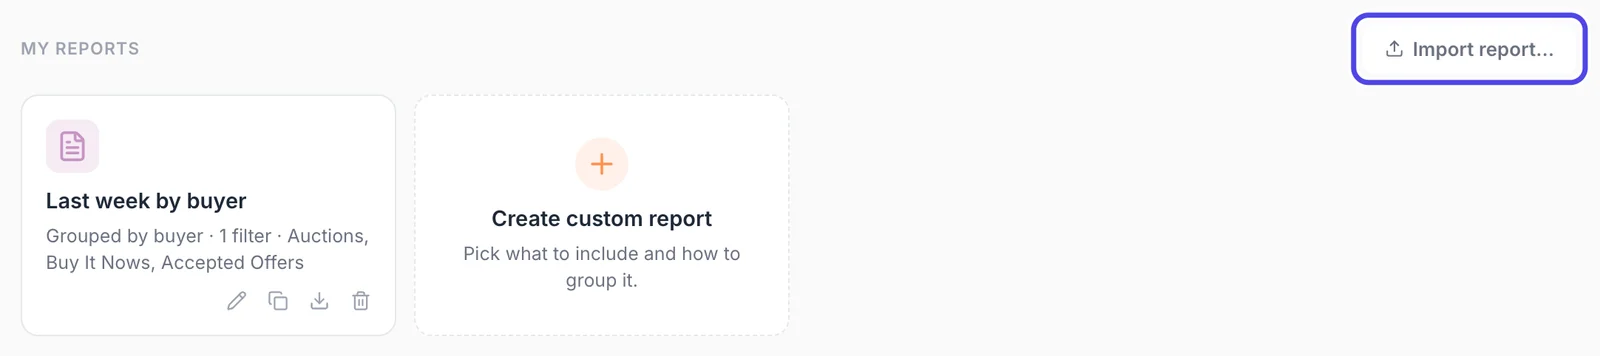
The small buttons at the bottom of its box are, from left to right: rename (pencil), make a copy, save the report to a file (arrow pointing down), and delete (bin). Delete asks once more: click Confirm to delete.

Step 25: Save the report to a file
To use the same report on your other computer, or to send it to someone who helps you pack, click the downward arrow under the report. Save the file somewhere you can reach from the other computer, like a USB stick or a shared folder, or email it to yourself.
The file holds only the report's choices. It has no sales or buyer information in it.

Step 26: Import it on the other computer
On the other computer, open NotBot, click Reports, then click Import report… at the right of My reports. Choose the file you saved and click Open.
The report appears under My reports there, and NotBot shows Imported "Last week by buyer".
If something looks different
Save as spreadsheet and Save as PDF are grey and the page says Nothing sold in this selection yet
Nothing matches your choices. Check the Show box and the When dates, make sure at least one kind of sale is ticked next to Include, and turn off filters one at a time with the tick box at the start of each filter.
Reports says Could not load show data
Click another tab in the top bar, like Show History, then click Reports again. If it keeps happening, close NotBot and open it again.
A show is missing from the Show list
Reports use the shows saved on this computer, the same ones you see in Show History under This computer. A show you ran on another computer is only on that computer.
The totals do not match my payout from the platform
Revenue adds up the sale prices NotBot saw during the show. It does not take off platform fees, shipping or tax, and it has no sales NotBot missed (for example while the connection was down). See Add a sale NotBot missed.
Import says Not a NotBot report file
Pick the file that ends in .notbot-report.json, made with the downward arrow button under a saved report. Spreadsheet (.csv) and PDF files cannot be imported.
Nothing happened when I clicked Save as spreadsheet or Save as PDF
A save window opens first; it may be behind NotBot. If you clicked Cancel in it, nothing is saved. Click the button again and choose a folder.